I Take Pictures Of My Watches. Here's What The Data Says
And why I still wouldn't buy a watch for Instagram.
By @midlifecrisiswatches·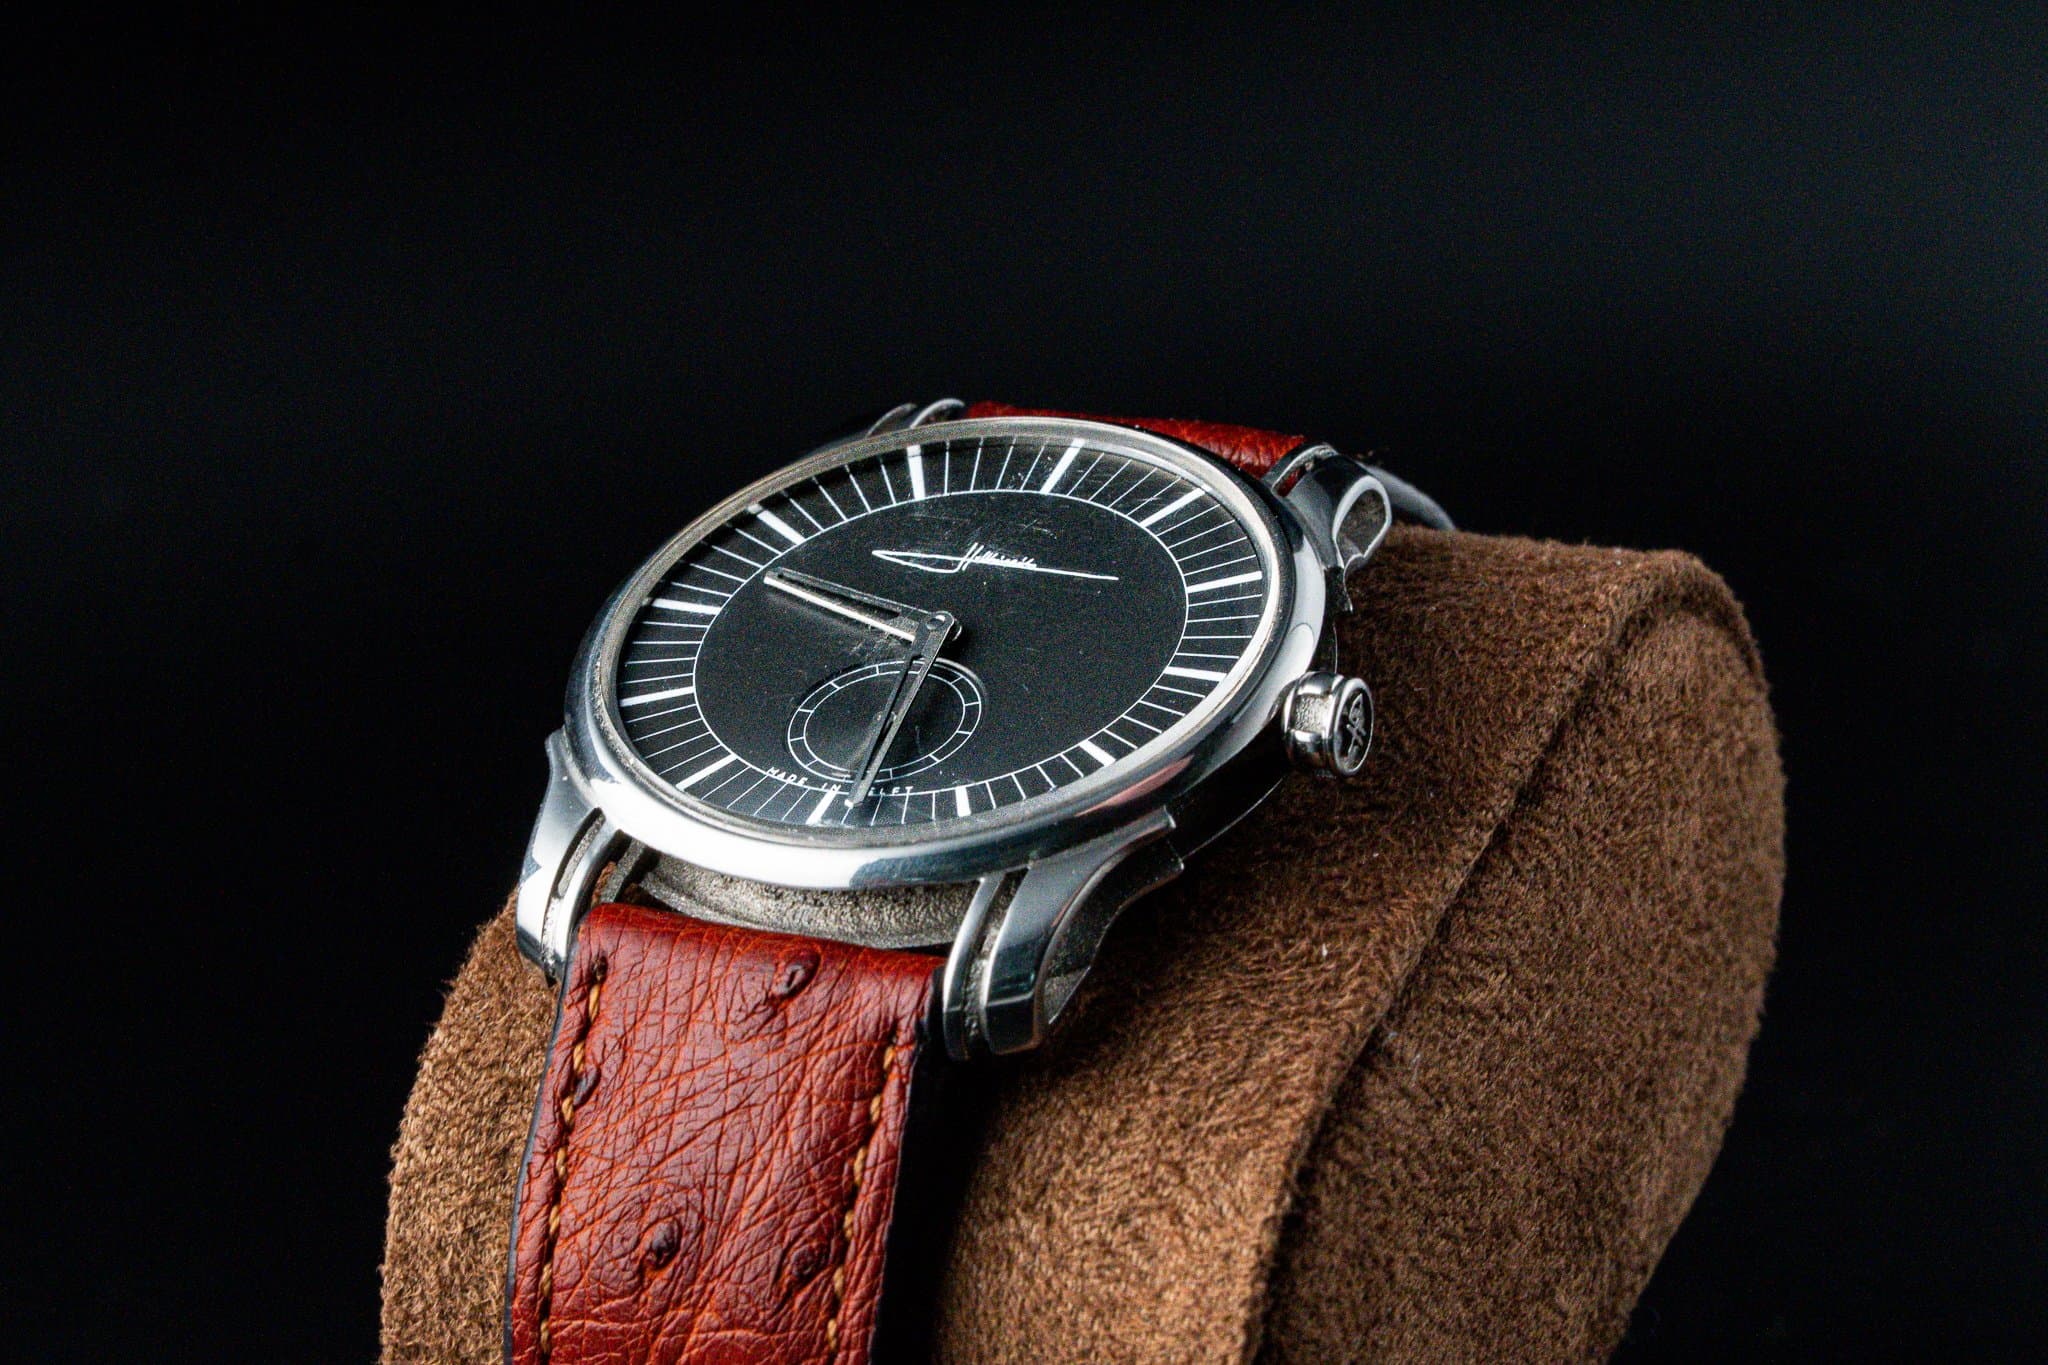
Lets get this out of the way upfront: I have never bought a watch because of Instagram.
I'll be clearer. I have never bought a watch hoping it would do well on Instagram. I've never stalked a reference because I thought it would photograph well, or chosen between two pieces based on which one would get more saves. That's a special kind of joyless collecting and not the path I've chosen within the hobby.
But I have been running @midlifecrisiswatches for just over a year. I post nearly every day. And a few months ago I started wondering what, exactly, the data actually says about which of my watches land with my audience and which ones don't. Not to change what I buy...but because I was curious what my audience's taste looks like when I finally measure it instead of guessing. What do the people who follow me actually care about? Is it what I think it is?
So I analyzed every post from the last year. 348 of them. I pulled engagement metrics from the Instagram Graph API: likes, saves, shares, reach. I ran every image through a vision model to extract the watch's brand, model, dial color, strap type, case material, and about thirty other features. I looked up reference specs for every unique piece. Then I just... studied.
Here's what I found.
The biggest post of the year wasn't a Rolex
My top post by reach was a Holthinrichs Signature Delft Blue. Nearly 98,000 accounts saw it. Almost a thousand people saved it. For context, my median post reaches about 700 accounts.
If you don't know Holthinrichs: they're a tiny Dutch independent making 3D-printed titanium cases with hand-engraved guilloché dials. The Delft Blue is a collaboration that leans into a specifically Dutch aesthetic tradition — the blue-and-white ceramics you'd see in a Vermeer painting, translated into a watch dial. It is not a watch that could exist without a specific point of view about what watches should look like.
My #2 by reach was a Grand Seiko Moonlit Birch (SLGW007). My #3 was a Zenith El Primero Chronomaster Lapis Lazuli. Notice a pattern... None of the three is a grail-hype piece. None of them is a Rolex or a Patek or an AP. They're all watches that require you to already care about fine movements, dial craft, and the particular kind of story each brand tells. They're collector watches in the most literal sense.
The usual suspects — the Submariners, the Speedmasters, the Daytonas — show up in my feed plenty. They just don't lead the list in terms of engagement metrics.
A quick note on what I'm counting
Before I get into the brand rankings, a housekeeping detail that matters. About 15% of my posts (52 of 348) are actually multi-watch scenes — State of the Collection series, watch box unveilings, "three Japanese greats on one table" kind of setups. Those posts are fine but they shouldn't count toward any single brand's performance, because the image features several watches at once. So when I talk about "brands that do well," I'm only counting posts where a single watch was the clear feature — 296 posts in total. Otherwise a Grand Seiko appearing as one piece in a six-watch collage would inflate Grand Seiko's numbers unfairly. I want the rankings to reflect posts where the audience is actually reacting to one specific watch.
I also want to point out that my audience has self selected itself over time. Meaning, people have chosen to follow me, as of writing, over 3750 of you. We are no longer gen-population and have a very curated taste. So, please take the below with a grain of salt - it's representative of my community, not the Internet at large.
The strongest brand signal in the entire dataset
Before I go into the detailed breakdown: the single most surprising finding on my feed is that my top-performing brand by engagement rate isn't a Swiss icon, a Japanese heritage maker, or a grail-hype piece. It's Studio Underd0g.
Studio Underd0g averages 19.5% engagement per post — 35% above my baseline and the highest lift of any brand with more than 5 single-watch posts in the dataset. For a British microbrand making playful, colorful chronographs, that's a real finding. The audience is telling me they respond to character and color more than to heritage or tier.
That doesn't mean Studio Underd0g is the "best" brand or the "correct" brand or anything like that. It just means that on my feed, with my audience, watches that commit to a clear aesthetic identity punch above watches that feel generic. Heuer, Omega, Seiko, Credor — the rest of my top 5 — all share that quality, for different reasons.
Which brands my audience actually saves
There are two numbers in Instagram's analytics that matter to me. One is engagement rate: likes and comments and shares, the broad-reach signal. The other is save rate: the percentage of people who reached a post who then bookmarked it. Saves are quiet. You don't perform them for anyone. When someone saves a watch photo, they're telling themselves "I want to remember this." It's the closest analog to a real collector signal that social media produces.
Here's the save-rate leaderboard for my feed, filtered to brands with at least five single-watch posts:
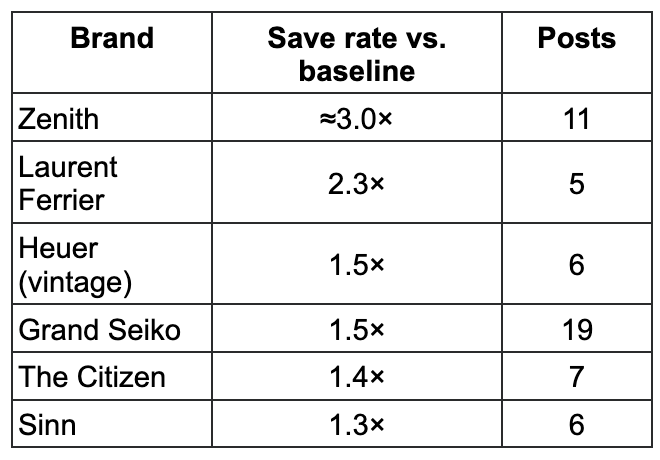
Zenith at nearly 3x the baseline is the single most dramatic number in the entire dataset. Posts of Zeniths get saved almost three times more often than the average post on my feed. Laurent Ferrier at 2.3x is the second-biggest signal. These are, not coincidentally, two of the most respected movement houses in the industry: Zenith for the El Primero, Laurent Ferrier for the Micro-Rotor.
Grand Seiko at 1.5x with 19 posts is a big deal too. That's not a small sample — 19 single-watch posts with a consistent save lift means the signal is robust, not a fluke. My audience treats Grand Seiko the way it deserves to be treated: as a peer of the Swiss majors, not as a "value alternative."
The people who save my watch posts are not the people chasing the hypebeast tier. They are people who read Unpolished, Enthusiasts and Hodinkee deep-dives, who can tell you the difference between a Genta-era integrated bracelet and a modern reinterpretation, who already know what the word rattrapante means. They save Zeniths because they want to own a Zenith.
The country story
I don't buy watches by country of origin, but the data has something to say about it anyway.
Swiss watches are my largest group: 107 single-watch posts covering the usual heritage makers plus the independent scene. Japanese watches are next with 65. But when you compare engagement rates:
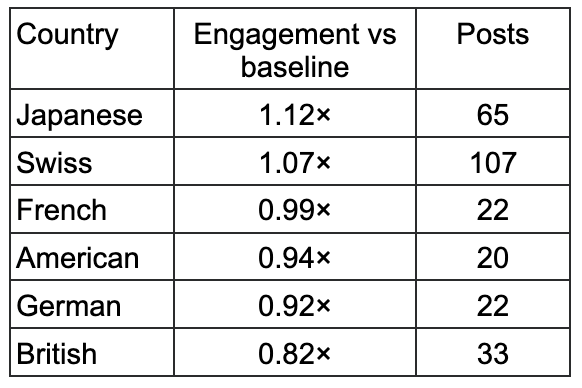
Japanese watches outperform Swiss on my feed. Not by a lot — 1.12 vs 1.07 — but consistently, and over a real sample. This is a real finding. My audience skews toward people who appreciate Japanese watchmaking as its own tradition, not as a budget alternative to Swiss. The Credors and Grand Seikos and even the more refined Citizens (The Citizen line specifically) punch above their share of posts.
The British number is interesting in the other direction. British watches on my feed underperform on engagement rate (0.82×): but they include Studio Underd0g, which is my #1 overall. What that tells me is that British watchmaking on my feed is a tale of two worlds: a few standouts that absolutely kill it, and a long tail of microbrands that don't quite land. When I post a Fears or a Trafford, it tends to hover near baseline. When I post a Studio Underd0g, it lifts 35% above it. "British" isn't really a category for my audience — the individual brands are.
Field watches beat dress watches
I post a lot of dress watches. 132 of my 296 single-watch posts were dress pieces. That's by far my largest category, which just reflects what's in my collection — I lean refined and understated.
But when I look at engagement rate by category, the ranking is almost exactly inverted:
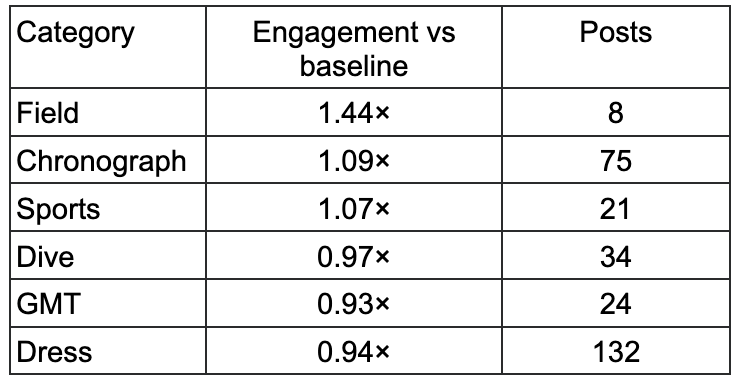
Eight field watch posts and they're punching at 1.4 times the baseline. My biggest category — dress watches — is slightly below baseline. The audience is telling me something specific: they respond to the most utilitarian, least fussy category I post, and they respond less to what I post the most of.
I'm not going to sell my dress watches. I like dress watches. But this is useful information about what my audience is telling me, which is not the same as what I'm telling them.
Tier doesn't matter as much as you'd think
Here's a counterintuitive one. If you look at my feed by market tier (entry / mid / luxury / haute horlogerie), the differences are much smaller than I expected:
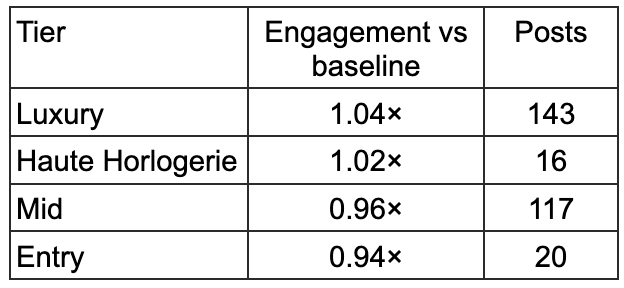
Everything is within ±6% of baseline. Haute horlogerie — the most expensive pieces — sits essentially at average. Luxury is barely above. Mid and entry are barely below.
What this tells me is that my audience doesn't reward price. They reward specific watches. A $400 Studio Underd0g can outperform a $40,000 haute horlogerie piece on my feed, if the Studio Underd0g has more character and the HH piece is photographed as a safe wrist shot. The tier number is a sort of permission to stop worrying about whether you "should" post the cheaper piece. You absolutely should, if it's the more interesting watch.
Dial colors and the blue problem
Among dial colors with at least seven posts, here's how they rank by engagement:
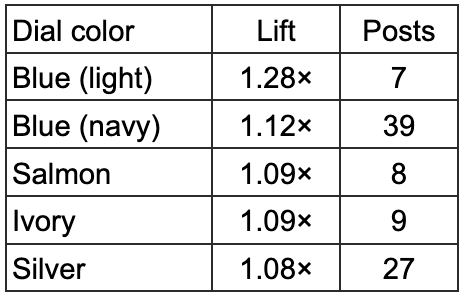
Light blue is the winner, but seven posts is a thin sample. What's more interesting is that navy blue at 39 posts still lifts 1.12× — that's a real finding with a real sample size. And the top five are all dials you'd describe as "quiet, classic, slightly warm or slightly cool, nothing loud."
Green is notably absent from the top. So is black — black dials hover at baseline on my feed despite being the most posted color with 60 entries. The audience, at least my audience, is tired of black dials.
This is consistent with what I've been reading in collector forums for a year. Black is the default. Blue is the considered choice. When you post a navy guilloché dial in soft daylight, you're not fighting for attention — you're showing something that's already in the same aesthetic category as what your audience is already reaching for.
Vintage and neo-vintage punch above their weight
I post mostly modern watches. The overwhelming majority of my single-watch posts are modern pieces. But:
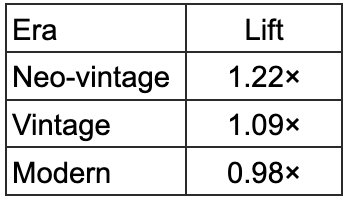
Neo-vintage, watches that look old but aren't yet, lifts 1.22× above baseline. Vintage proper (pre-1990, patina, aged lume) lifts 1.09×. Both beat the modern category by a clear margin. Again, I'm not going to stop posting modern watches. But the signal is there: the audience resonates with watches that tell a story about watchmaking's past, whether that's a genuine 1970s piece or a modern reinterpretation of one.
Here's what I'm actually taking from all this
I started this exercise half-expecting to find that my audience wanted more Rolex, more "grails," more of what you'd guess if you'd never looked at the data. What I found instead was that the people who follow me have, on average, more refined and more specific taste than I assumed.
They care about independent makers. They reward Japanese heritage. They save Zeniths at three times the rate they save the obvious stuff. They engage with field watches more than dress watches. They'd rather see a dial with a story than a dial with a crown on it. They don't reward me for posting expensive watches, they reward me for posting interesting ones.
Which is a nice finding, because it means my audience and I want mostly the same things.
I'm not going to change what I buy. I bought my Parmigiani Tonda because I wanted a Parmigiani Tonda. I bought my Credors because I've been a Credor nerd. I bought my Holthinrichs because an art-object watch from a Dutch independent was exactly what I wanted in my collection, and the fact that nearly a hundred thousand people later saw it on Instagram is a nice coincidence, not the reason I bought it.
But I am going to change a few things about how I post. I'm going to spend more time on my less-obvious pieces. I'm going to lean into vintage and neo-vintage stories. I'm going to photograph my Japanese pieces the way they deserve to be photographed. I'm going to stop defaulting to dress watches just because I own the most of them.
The audience is telling me what they care about. I was already making most of those choices intuitively. Now I know which ones I was right about and which ones I wasn't. Note, I'm still going to post what I want to post, when I want to post. However, having this data helps me think it through.
The thing I want to leave you with
If you're a collector and you're reading this, here's the idea I'd want you to take away: the watches that do well on Instagram for me are the watches I would have bought anyway. The overlap isn't coincidence. It's that my audience is, in aggregate, people who share most of my taste (Insta algo working). If I were buying watches for reach, I'd be buying hype pieces and getting mediocre engagement on them. Instead I'm buying what I actually want and discovering that my people are out there, quietly saving my posts.
Buy the watch because you love the watch. The rest takes care of itself.
-Darren MLCW
How to do this yourself
If you've read this far and you're thinking "I'd actually like to know what my own collection looks like through this lens"... you can. The whole thing is more approachable than it sounds. Here's the framework, broken into five steps, in roughly the order I did them.
1. Get your data out of Instagram
Start by requesting a personal data export from Instagram. On the app, it's under Settings → Accounts Center → Your information and permissions → Download your information. Request the JSON format, full history, high-quality media. It takes a few hours. You'll end up with a zip file containing every post you've ever made as a JSON entry plus the original image files.
This is your raw material. It gives you captions, timestamps, and the original (uncompressed) photos — which matters, because Instagram's in-feed JPEGs are heavily compressed.
2. Get engagement data via the Instagram Graph API
The export has your posts but doesn't have engagement metrics like reach and saves — those come from the Instagram Graph API, which is a separate (free) data source you access through a Facebook Developer account.
This is the fiddliest step. You'll need to:
Create a Facebook Page and link it to your Instagram account (if they aren't already linked)
Create an app at developers.facebook.com
Request the instagram_manage_insights permission
Generate an access token and exchange it for a long-lived 60-day version
If that sounds like a lot, it is. But it's a one-time setup and everything else in the project depends on it, because save rate is the signal that matters most and you can't get save rate from the personal data export. Block out an hour for this step specifically. If you get stuck on the permissions dance, the Meta developer forums are surprisingly helpful.
3. Run every photo through an AI vision model
Here's where it gets interesting. Take every post image and send it through a vision-capable AI model (I used Claude Sonnet 4.6 from Anthropic). Ask it to extract structured features for each photo: brand, model, dial color, strap type, case material, shot type, lighting, composition, mood, palette, and so on.
Two tips that matter a lot here:
First, pass the caption along with the image. The model is dramatically better at identifying microbrands and independents when it can read what you wrote about the watch. Without the caption, it tends to confidently misidentify obscure pieces as famous ones. With the caption, it gets them right, even pieces like Holthinrichs, Trafford, or Studio Underd0g that wouldn't be in most training sets.
Second, let the model return "unknown". Tell it explicitly that if it can't clearly see a brand mark or recognize the dial layout, the answer is "unknown" — not the nearest famous-brand guess. Hallucination is the enemy of a trustworthy dataset.
4. Look up reference specs for each unique watch
Once you know what watches are in the collection, ask the same AI model (with web search enabled) to look up reference specs for each unique brand + model pair: country of origin, tier (entry/mid/luxury/haute horlogerie), era, movement type, water resistance, original retail, and so on. Cache these so you don't re-query the same watch twice.
This is what gives you the ability to ask questions like "do Japanese watches outperform Swiss" or "does haute horlogerie lift over luxury." Without the enrichment step, you only have the post-level data and can't ask country or tier questions.
5. Join everything and ask questions
At this point you have three datasets: the posts (images + captions), the engagement metrics (reach, saves, shares), and the per-watch specs (country, tier, movement). Join them on post ID and on the brand+model pair, and you have one table where every row is a post and every column is something you can group by.
From there it's mostly just asking questions: group by brand, compute mean engagement rate, sort descending. Do that for every dimension you care about. The patterns fall out quickly.
One subtlety that's easy to miss: filter out multi-watch group shots before computing brand-level averages. About 15% of my posts are "State of the Collection" or "watch box unveiling" series featuring several watches at once, and they shouldn't count toward any single brand's average. Exclude those and your numbers get noticeably cleaner.
A few honest notes if you're going to try this:
Cost: The AI calls will run you somewhere between $10 and $25 total for a year of daily posts. The Instagram Graph API is free. Nothing else costs anything.
Time: Plan on a full weekend for the first run. Most of it is the Graph API setup and understanding the data. Subsequent refreshes are closer to 20 minutes.
What you'll need technically: Python, pandas, an Anthropic API account, and patience with Facebook's developer console. You don't need to be a software engineer, but you need to be comfortable running scripts from a terminal.
What you'll actually get: a dashboard of your own taste. Worth it.
If all of that sounds like more than you want to take on, that's fine too. Most of the value of this exercise is just knowing the questions to ask — which brands resonate, which dial colors land, whether your audience skews toward heritage or independents. You can get 80% of the insight by scrolling through your own Top 20 posts thoughtfully and asking "what do these have in common?" The data just makes you more rigorous about the answer.
Either way, the point isn't the technical pipeline. The point is measuring your own taste honestly. You can do that with code, with a spreadsheet, or with a good memory and a willing friend. The tools are secondary.